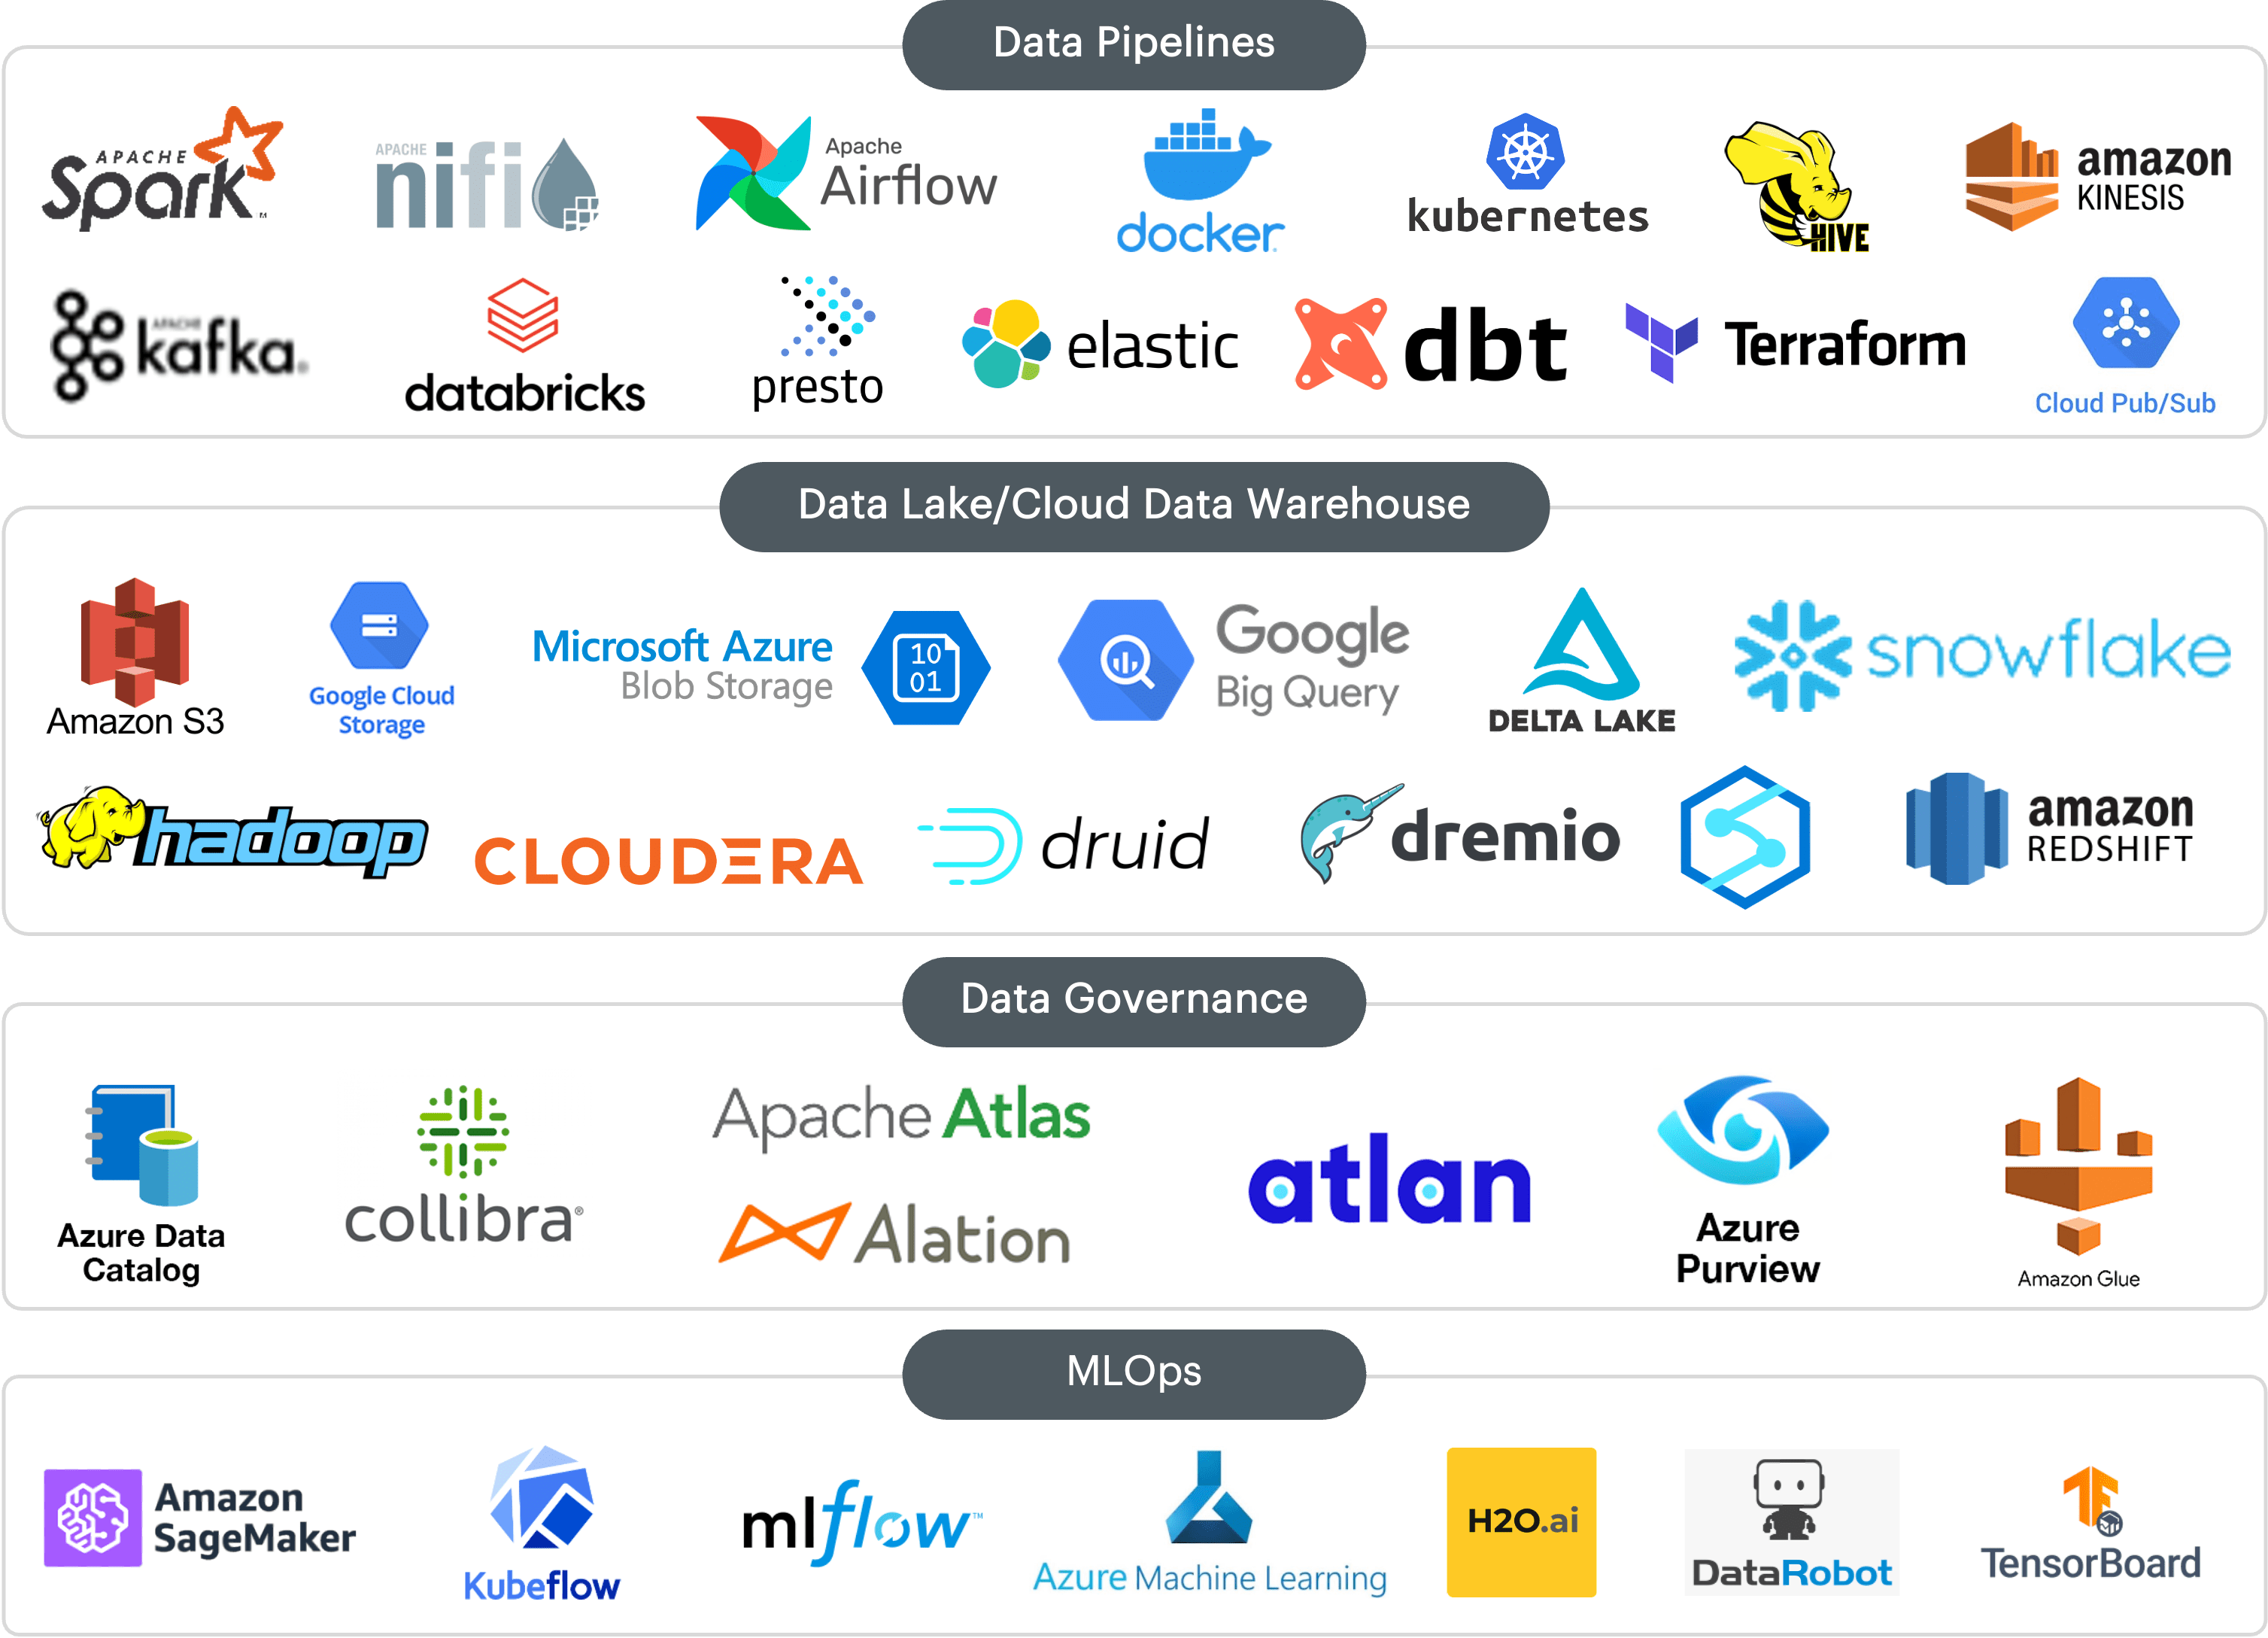
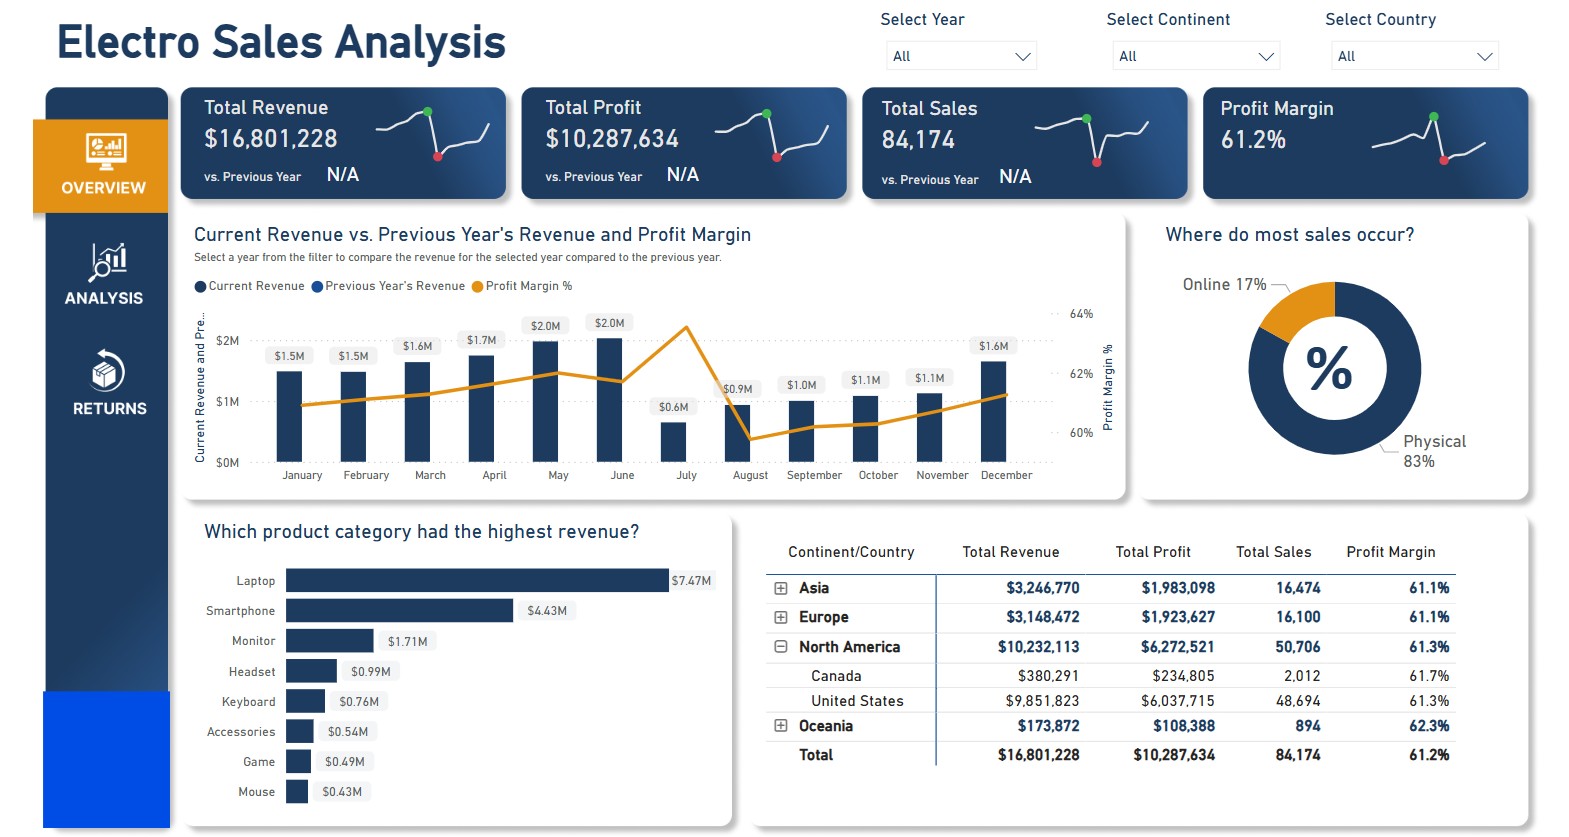
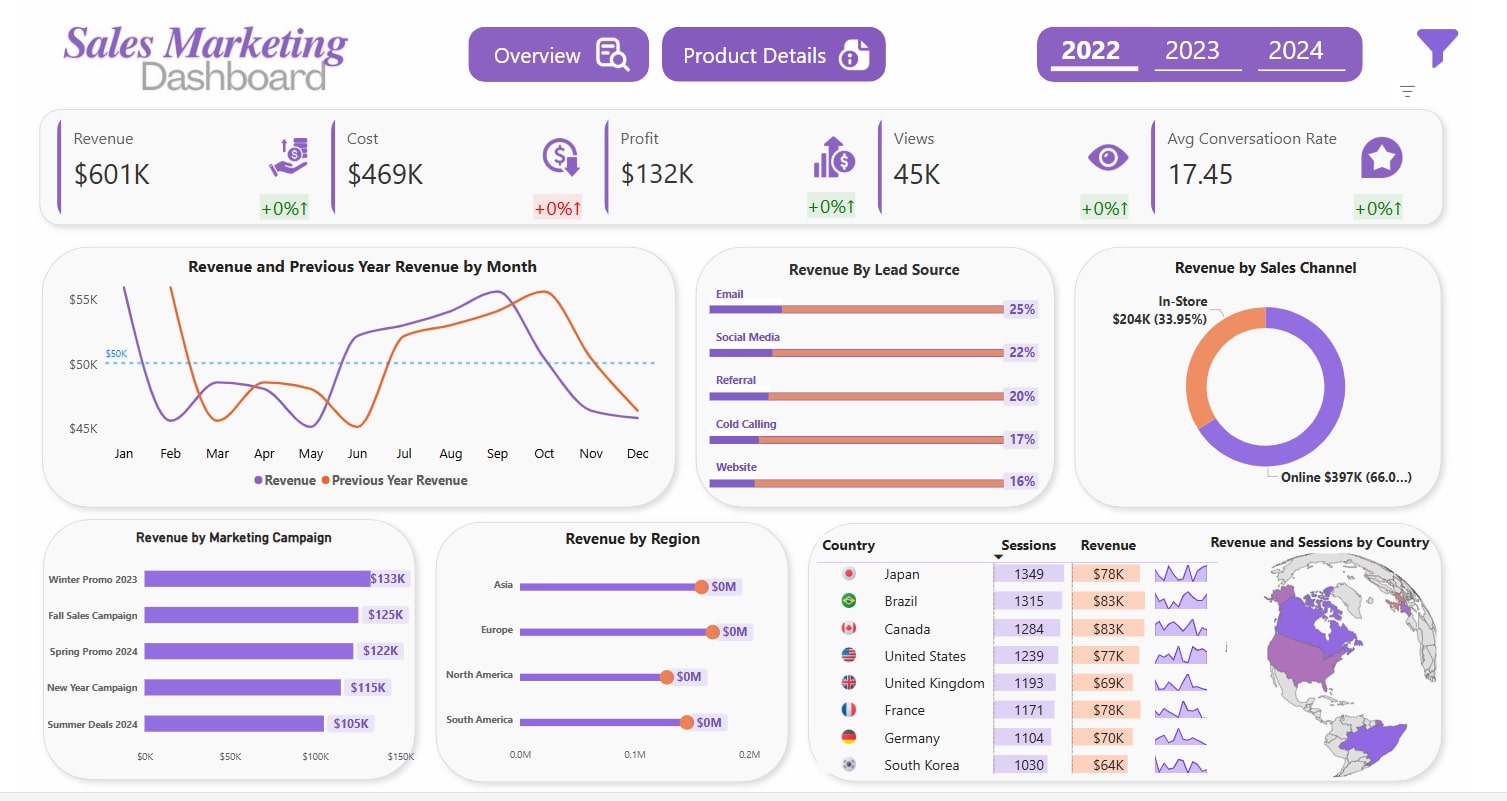
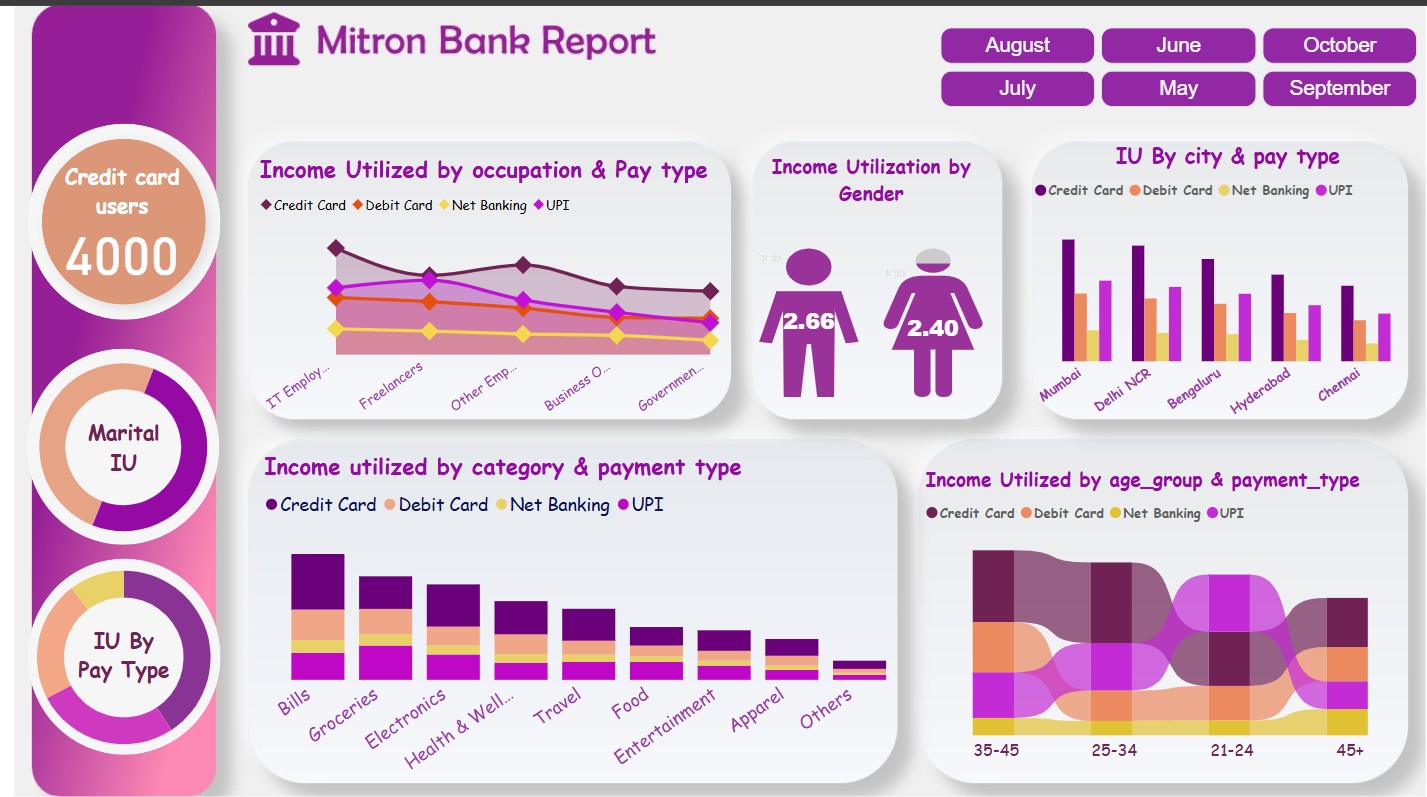
At NextWorld IT Company, our objective is to deliver results-driven data engineering and business intelligence solutions that empower organizations to make smarter, faster decisions. With over five years of experience, we specialize in data modeling, ETL pipelines, and building dynamic Power BI dashboards. Our mission is to transform raw data into meaningful insights through advanced analytics, cloud technologies, and seamless collaboration ensuring scalable, efficient, and impactful data strategies for our clients.
Cost-Effective Solutions
High Quality Product
Adherence to Deadlines
Read More
Delivering high-quality data solutions that drive business success. Committed to excellence in data engineering and Power BI development, ensuring insightful analytics and seamless data management.
Successfully delivered data-driven solutions, including ETL pipelines, data warehousing, and interactive Power BI dashboards. Focused on optimizing business intelligence and enhancing decision-making through efficient data engineering.
Experienced Data Engineer & Power BI Developer with expertise in ETL pipelines, data modeling, and interactive dashboard development. Proficient in SQL, Python, and cloud platforms like Azure and AWS. Skilled in optimizing data workflows, designing scalable architectures, and transforming raw data into actionable insights. Adept at collaborating with stakeholders to drive data-driven decision-making.
2021 - 2025
2021 - 2025
2023 - 2025
2020 - 2025
2017 - 2021
2020 - 2021
September 2024
2022 - 2023
July 2025
Comprehensive business intelligence dashboard for electronics retail operations. Features real-time sales analytics, profit tracking, and multi-dimensional performance insights.
Developed an interactive dashboard to analyze sales and marketing performance by region, country, sales channel, and lead source. It provides key insights into revenue, profit, campaign effectiveness, and customer engagement to support data-driven decision-making.
Macter is a comprehensive healthcare management dashboard designed for monitoring pharmaceutical operations, patient care, and medication delivery services. It provides real-time insights into order management, patient follow-ups, and sales analytics for healthcare providers.
The dashboard delivers key insights into customer demographics, spending behavior, risk profiles, and market segmentation to guide data-driven decision-making. The report includes interactive visualizations, trend analysis, and scenario-based forecasting to assist in identifying target customer segments and optimizing credit card features.
Created a Power BI dashboard to analyze daily performance metrics across cities, devices, channels, and ads. It provides key insights into conversions, ad spend, and click performance, helping optimize Meta marketing campaigns through data-driven decisions.
Developed an interactive monthly and weekly performance dashboard for a clinic, powered by real-time data from Google Sheets. Focused on sales KPIs, client behavior, and rebooking trends to drive actionable insights and business growth.
Built an interactive sales performance dashboard using Google Sheets data to analyze revenue trends, product pricing, buyer behavior, and regional sales insights across multiple countries.
Multi-campaign performance tracking, revenue analytics ($198,206K total), conversion rate monitoring (20.17%), customer acquisition metrics, channel effectiveness analysis, ROI measurement, real-time campaign optimization.
Developed a comprehensive financial analytics dashboard for a pharmaceutical company delivering complete visibility into key industry metrics, sales performance, and resource management.
Developed a comprehensive logistics dashboard focusing on inventory management and warehouse occupancy optimization. The system tracks $566M in revenue across 34K orders with detailed supplier analysis including major technology brands (Dell, Acer, Samsung, Lenovo, Apple).
Developed a comprehensive agricultural dashboard for AgroFruits providing complete visibility into revenue ($234M) and production volumes (75M units) across multiple farms and international markets.
Developed and implemented robust ETL pipelines for seamless data extraction, transformation, and loading processes.
Designed and developed Power BI and Microsoft Report Builder dashboards and reports for Mercedes-Benz Australia’s enterprise-wide Tracking Dashboard.
Played a key role in stabilizing critical financial systems by addressing data integrity issues that surfaced after the project’s go-live phase.
Served as the only dedicated resource responsible for maintaining and enhancing the ETL workflows for RMW, a DFSI financial application used across 10+ global markets, including Taiwan, Japan, India, and Australia.
An interactive Power BI dashboard built to track construction progress for the Salesforce Tower project. It visualizes key metrics like start/finish dates, task progress, milestone completion, and monthly performance trends. Designed to support real-time decision-making for project managers using actual vs. planned data insights.
The Power BI dashboards created by asif provided incredible insights and improved our decision-making process. Highly recommended!
Asif's PowerBI expertise transformed our reporting capabilities. The automated dashboards save us 20+ hours weekly!
Outstanding work on our data warehouse integration. Asif delivered beyond expectations with clean, efficient solutions!
The financial reporting system Asif built is exceptional. Real-time insights that drive our investment decisions daily.
Asif's supply chain dashboard revolutionized our operations. 30% improvement in efficiency within the first month.
Incredible technical skills combined with business understanding. Asif is our go-to expert for all PowerBI projects.
Asif built efficient ETL pipelines for our company, optimizing data flow and performance. A true professional in Data Engineering!
The data models and reports developed were top-notch. Timely delivery and exceptional service!