Portfolio Details
Financial Analytics Dashboard

Project information
- Category: Pharmaceutical Financial Analytics
- Client: DataPharma (Pharmaceutical Company)
- Tools Used: Power BI, DAX, Excel, Financial Modeling, Geographic Analytics, Time Series Analysis
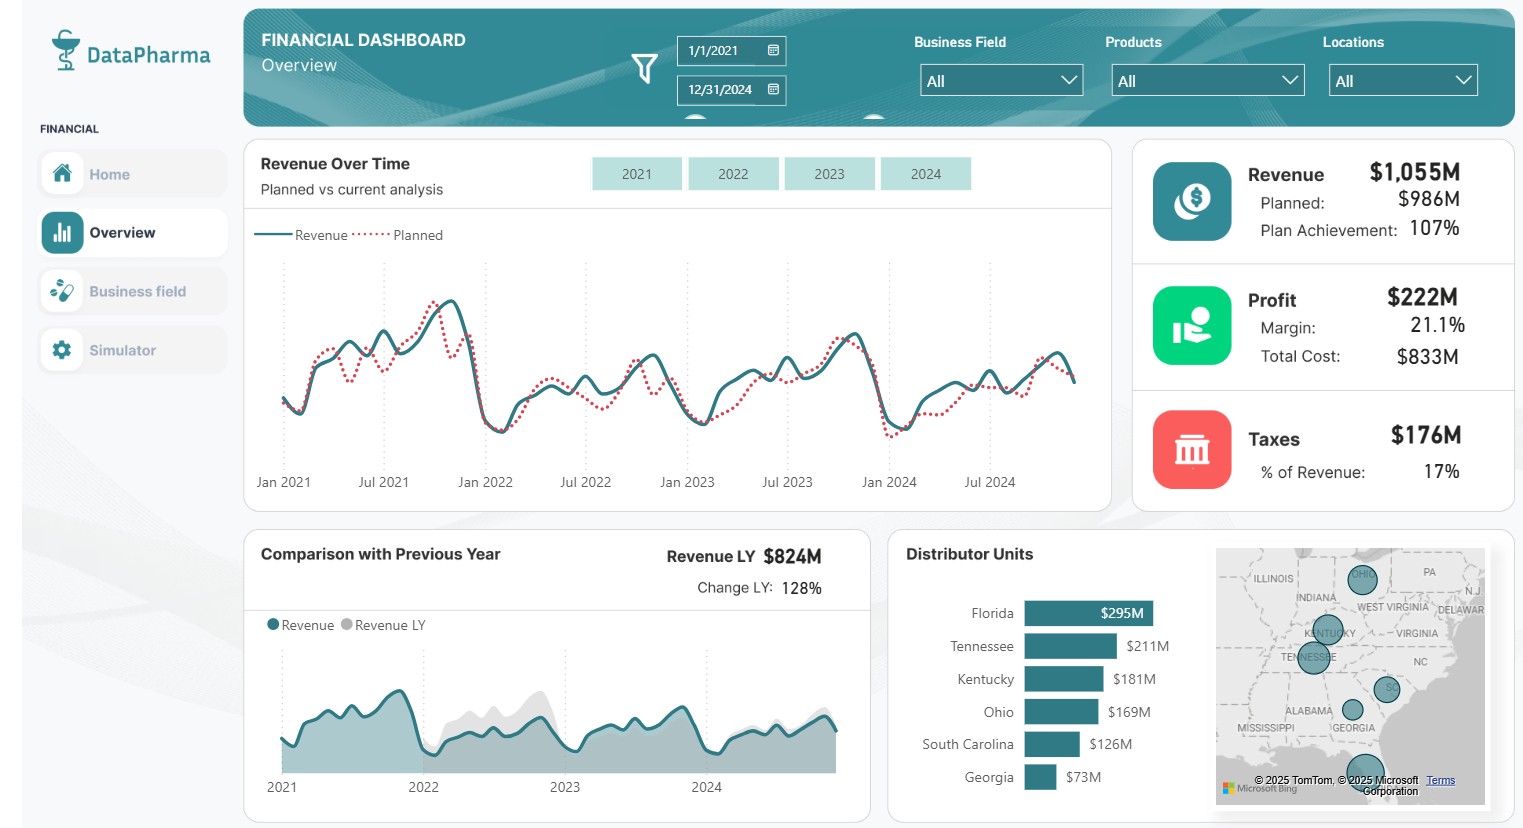
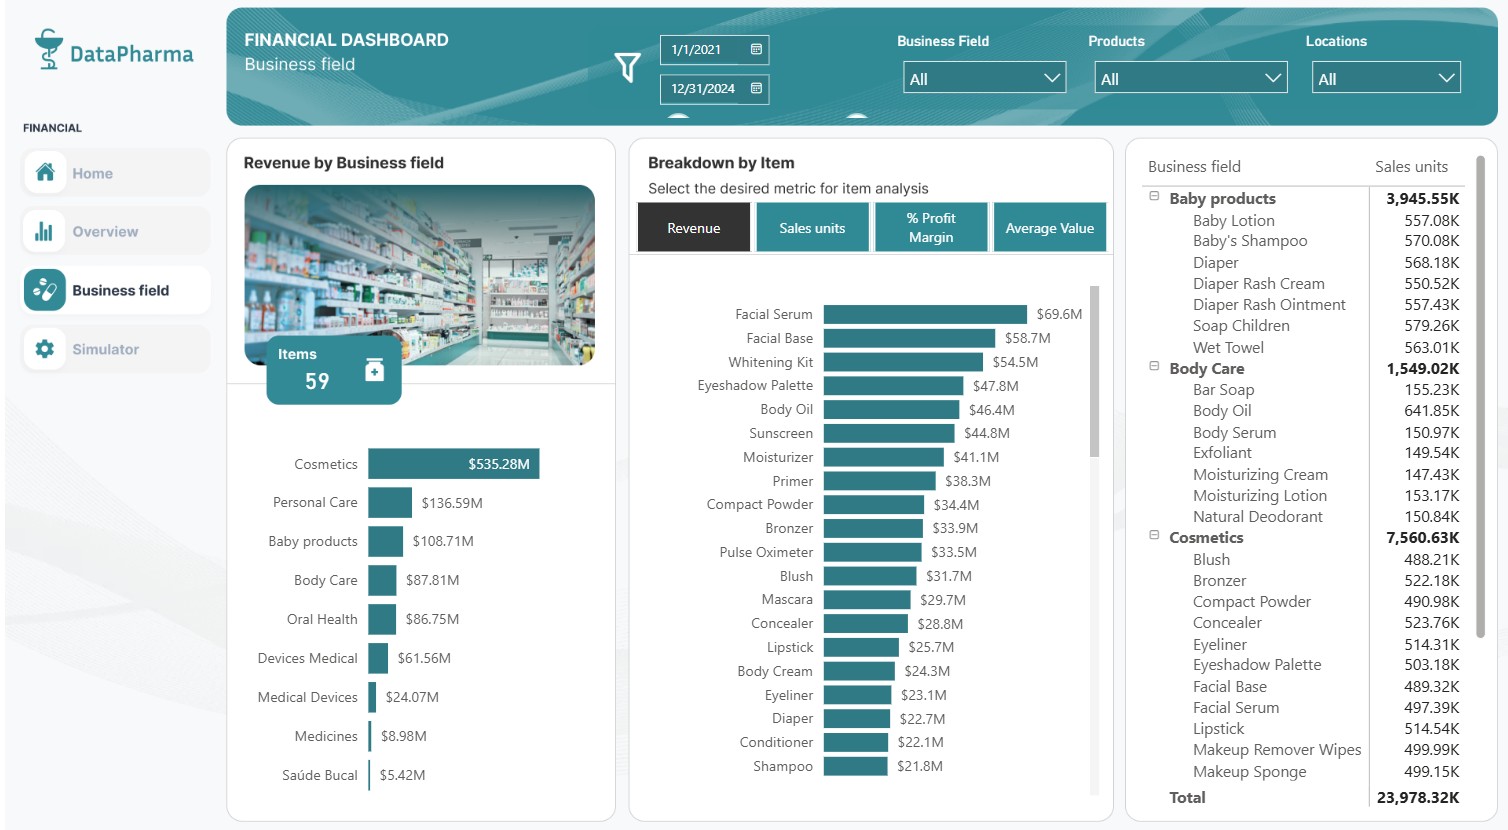
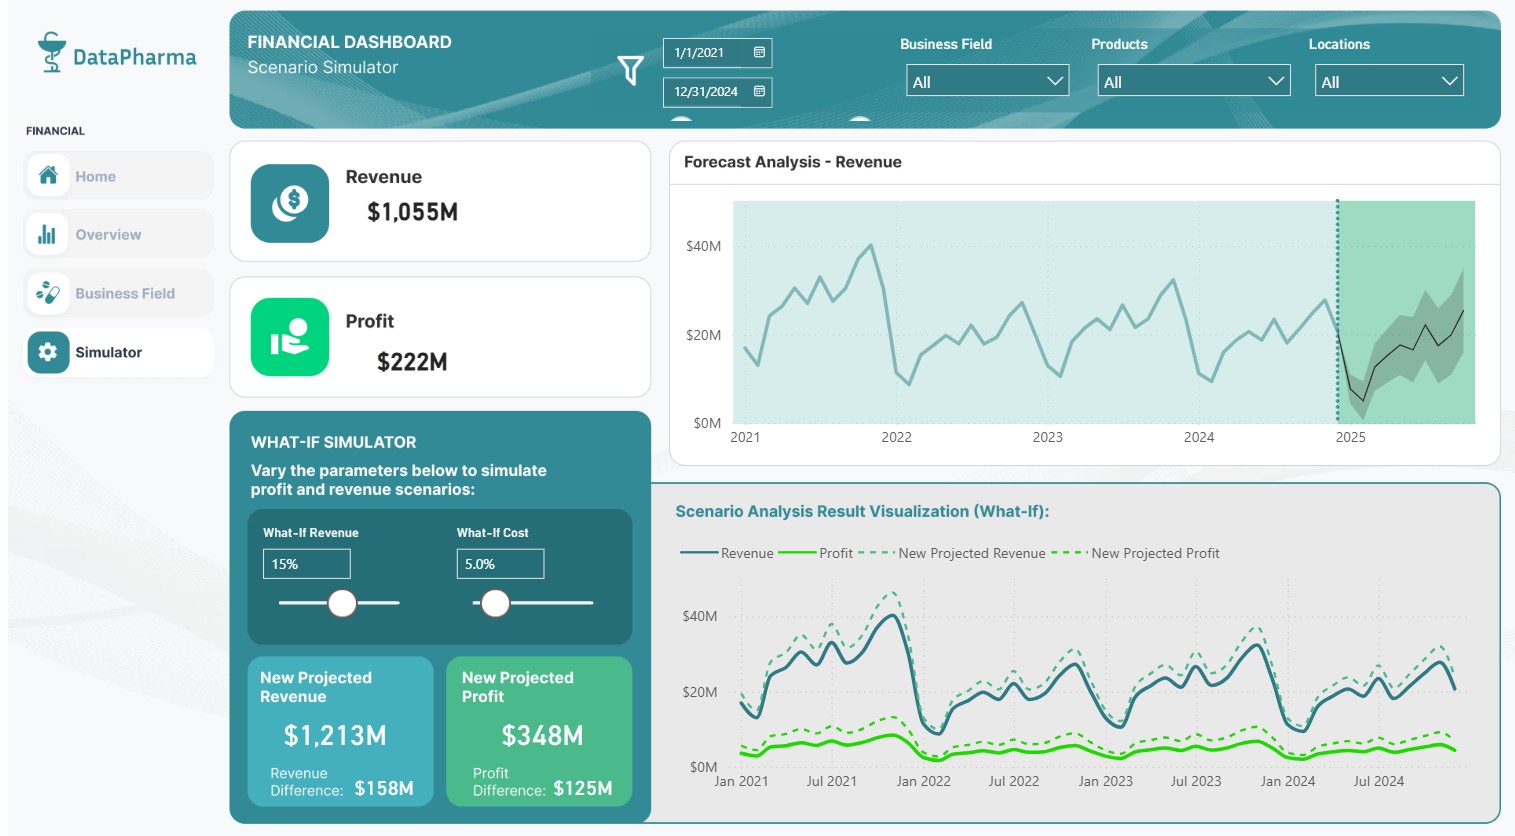
- Key Features: Revenue tracking ($1,055M), profit margin analysis (21.1%), plan vs actual performance monitoring (107% achievement), multi-year trend analysis (2021-2024), geographic distribution mapping, tax optimization tracking ($176M), year-over-year growth analysis (128% increase).
- Project date: 2024-2025
- Project URL: Report Link
Financial Analytics Dashboard
Developed a comprehensive financial analytics dashboard for a pharmaceutical company delivering complete visibility into key industry metrics, sales performance, and resource management. The system tracks $1,055M in revenue with 107% plan achievement, monitors profit margins of 21.1%, and provides geographic distribution analysis across multiple states including Florida ($295M), Tennessee ($211M), and Kentucky ($181M). The dashboard enables strategic financial planning through year-over-year comparisons showing 128% growth, tax management ($176M), and future scenario projections for data-driven pharmaceutical business decisions.